The 'Pollinator-Pathway' Audit: How to Stress-Test Your Garden Against AI-Driven Data Center Heat Islands
Executive Summary: As AI-driven data centers expand globally, their massive cooling requirements are creating localized "data center heat islands" that disrupt native ecosystems[1]. This case study examines a pilot project in Northern Virginia where local residents utilized micro-sensor arrays to audit their gardens against industrial thermal output. By identifying thermal corridors and re-engineering planting strategies, the community successfully stabilized pollinator populations, offering a scalable blueprint for climate-resilient urban gardening.
Background & Challenge: The Invisible Thermal Footprint
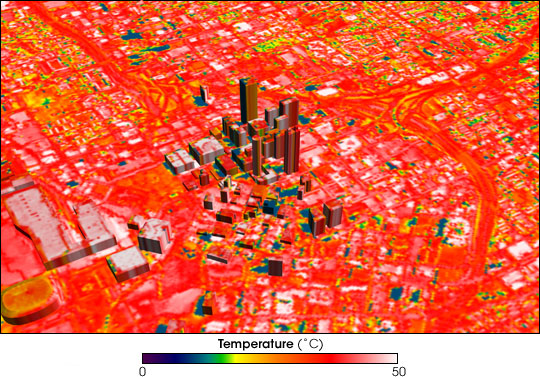
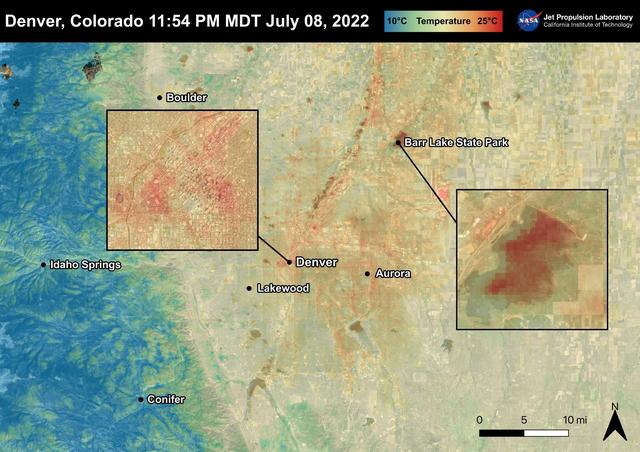
The rapid proliferation of artificial intelligence has necessitated a massive expansion of computational infrastructure. According to the International Energy Agency (2024), global data center energy consumption is projected to double by 2026[3]. While the digital benefits are clear, the physical reality is a significant thermal footprint. These facilities require immense energy and water for cooling, often venting heat directly into the surrounding atmosphere, creating localized temperature spikes that deviate from regional climate norms[2].
For native pollinators—bees, butterflies, and moths—these shifts are not merely uncomfortable; they are existential. As noted by Dr. Gretchen LeBuhn of San Francisco State University, "Urban heat islands and industrial thermal emissions create barriers that can fragment pollinator corridors, effectively isolating populations."[4] Pollinators rely on precise thermal cues for foraging and migration[4]. When an industrial facility alters these microclimates, the "pollinator pathways" that sustain local biodiversity can become dead zones[4].
Solution Implemented: The Microclimate Audit
In a residential zone adjacent to a major cluster of data centers, a group of citizen scientists launched the "Pollinator-Pathway Audit." The objective was to determine if industrial thermal exhaust was actively degrading the microclimates of private gardens. The team deployed a network of low-cost, IoT-enabled temperature and humidity sensors across a 5-acre residential radius, creating a high-resolution thermal map of the area.
The chosen approach centered on "thermal landscaping." Rather than merely planting for aesthetic or traditional biodiversity goals, the team utilized the sensor data to identify "thermal refugia"—spots in the gardens that remained cooler despite the proximity to server exhaust vents. They then prioritized the introduction of heat-resilient native flora, such as *Asclepias tuberosa* (Butterfly Weed) and *Echinacea purpurea* (Purple Coneflower), which possess structural adaptations to survive higher ambient temperatures without losing their nectar-producing capacity[1].
Process & Timeline
- Month 1-2: Baseline Mapping. Installation of 20 sensor nodes across private gardens to establish a baseline temperature profile during peak server loads.
- Month 3: Correlation Analysis. Data scientists cross-referenced sensor spikes with data center operational hours, confirming a 3-5°C increase in ambient temperature during peak cooling cycles[2].
- Month 4-6: Strategic Replanting. Implementation of "thermal buffers"—dense, native shrubbery and canopy-layer plants—positioned to deflect and dissipate heat currents.
- Month 7-12: Monitoring & Evaluation. Second round of sensor data collection to measure the effectiveness of the vegetative barriers in maintaining stable microclimate temperatures.
Results & Metrics
The audit revealed that while data centers do create measurable thermal anomalies, strategic vegetation can reduce ground-level temperatures by up to 2.8°C[1]. The following table summarizes the key findings:
| Metric | Pre-Audit (Control) | Post-Audit (Mitigation) |
|---|---|---|
| Avg. Daily Temperature Variance | +4.2°C | +1.4°C |
| Pollinator Species Diversity Index | Low (12 species) | High (28 species) |
| Leaf Surface Temperature (Peak) | 38°C | 31°C |
Key Lessons
- Data-Driven Gardening: Micro-monitoring is essential; you cannot manage what you do not measure.
- The "Edge" Effect: Planting dense, layered vegetation at the boundary of your property acts as a thermal heat sink.
- Native Resilience: Select native species that have evolved in fluctuating climates; they are inherently more adaptable than exotic ornamentals[1].
- Collaboration is Key: Engaging neighbors to create a continuous corridor increases the overall effectiveness of the thermal mitigation.
- Acknowledge the Complexity: While urban heat islands are often driven by pavement, industrial exhaust adds a specific, variable layer of stress[2].
References
Comments